Table of Contents
A fuse time current curve shows how long a fuse takes to respond to different levels of overcurrent. It is one of the most important technical references for understanding fuse operation, evaluating protection coordination and selecting a suitable fuse for electrical equipment.
The basic relationship is straightforward: higher fault current generally results in shorter fuse operating time. However, reading the graph correctly requires distinguishing between melting time, arcing time and total clearing time.
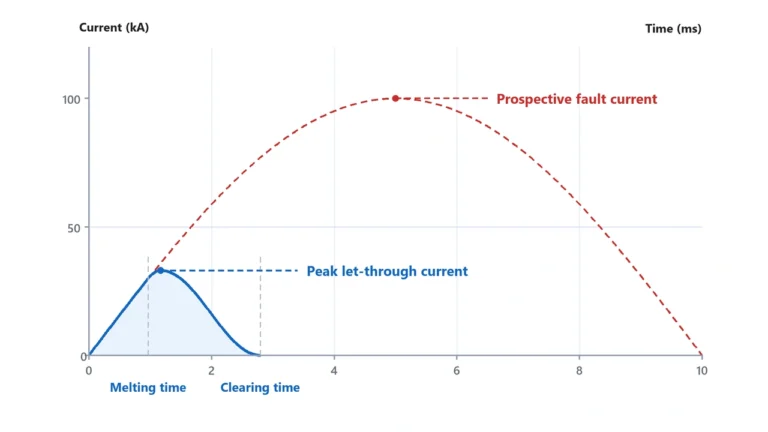
These values are not interchangeable. A fuse element may already have melted while electrical current continues flowing through an internal arc.
For DC and photovoltaic systems, the distinction is particularly important because direct current has no periodic natural current-zero crossings to assist arc extinction.
This guide explains how to read fuse time-current characteristics, interpret I²t data and evaluate whether a fuse’s operating performance is appropriate for a DC or solar PV circuit.
For general fuse ratings, voltage selection and breaking capacity, start with our DC Fuse Guide.
What Does a Fuse Time Current Curve Show?
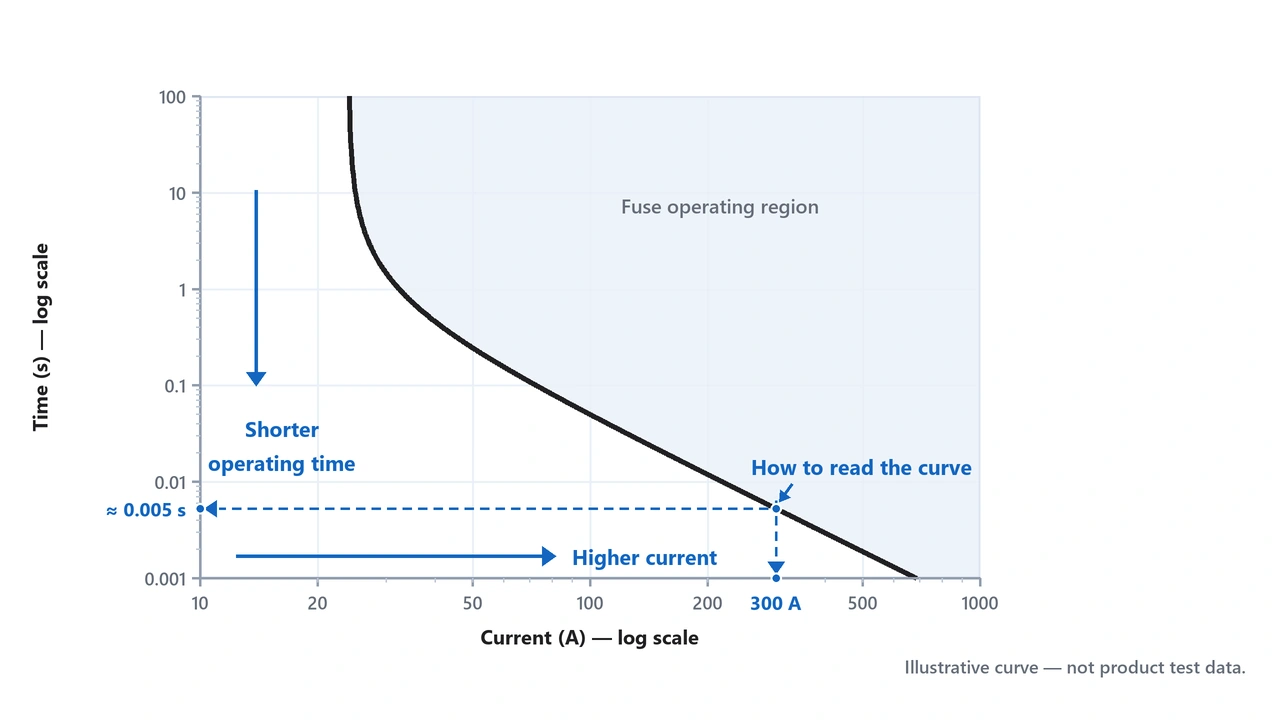
A time-current curve, often abbreviated TCC, describes the relationship between overcurrent magnitude and fuse operating time under specified test conditions.
Most fuse time-current graphs use two logarithmic axes.
| Graph Element | Meaning |
|---|---|
| Horizontal axis (X) | Current in A, kA or multiples of rated current |
| Vertical axis (Y) | Time, commonly in seconds |
| Curve | The manufacturer’s specified time-current characteristic |
| Curve label | Identifies fuse model, current rating or fuse family |
| Tolerance band | Represents a specified range of operating characteristics, where provided |
A curve generally slopes downward from left to right.
At relatively low overcurrent, the fuse may require a long time to operate. At sufficiently high fault current, operation can occur much faster.
The exact characteristic depends on fuse design.
Why Are Both Axes Logarithmic?
Fuse operating conditions span a very wide range.
A characteristic curve may need to display time values from milliseconds to many seconds or longer, while representing current levels extending from modest overloads to severe short circuits.
A logarithmic scale allows this range to fit into one readable graph.
However, equal distances on a logarithmic axis do not represent equal numerical increments.
For example, the distance from 10 A to 100 A can be the same as the distance from 100 A to 1000 A.
This is why a fuse curve should not be interpreted as an ordinary linear graph.
Does a 20 A Fuse Blow at 20 A?
Not necessarily.
A 20 A fuse is not generally designed to open immediately when current reaches 20 A.
Its rated current and time-current characteristic must be interpreted together with the manufacturer’s stated operating conditions.
A small overload may persist for a considerable time before the element melts.
At other current levels, the relevant standard may specify conventional non-fusing and fusing-current tests.
The actual characteristic should therefore come from the specific fuse datasheet rather than a universal rule such as:
20 A fuse → opens immediately above 20 A
The technical reference provided by SCHURTER on fuse-link characteristics distinguishes the pre-arcing time-current characteristic from the complete operating time and explains how these values relate to fuse behavior.
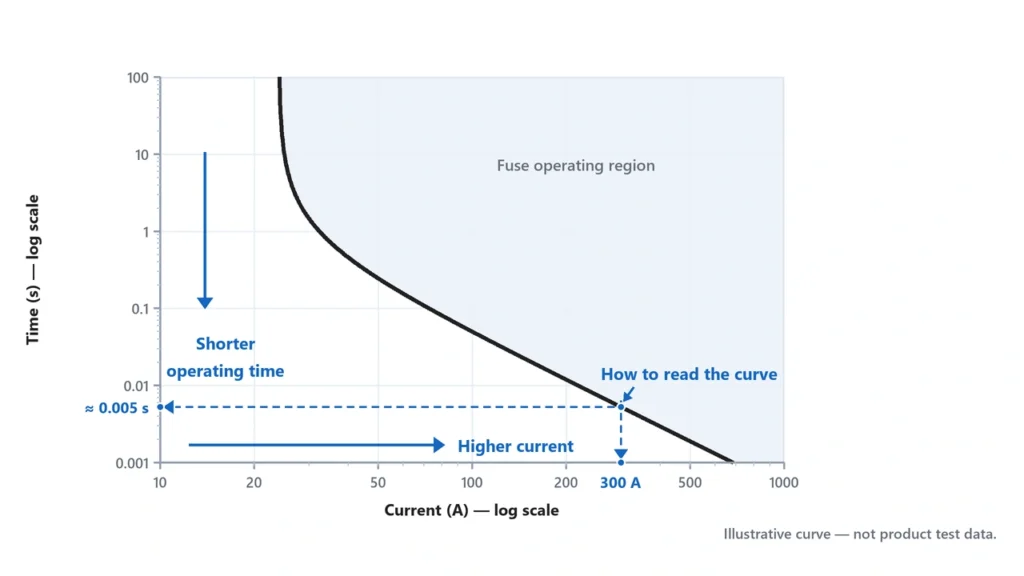
Fuse time current curve with logarithmic current and operating time axesHow to Read a Fuse Time Current Curve
A fuse time-current graph becomes easier to use when read in a fixed sequence.
Step 1: Identify the Exact Fuse Curve
Start with the manufacturer’s datasheet.
Verify:
- fuse manufacturer and series;
- fuse current rating;
- utilization category;
- curve type;
- current-axis units;
- time-axis units;
- specified test conditions.
Do not use the curve for a physically similar fuse from another product series.
For example, two fuses with identical:
20 A / 1000 V DC
markings can still have different time-current characteristics.
One may be designed for photovoltaic applications, while another belongs to a different DC fuse category.
Step 2: Locate the Current on the Horizontal Axis
Suppose you need to evaluate the fuse response at a prospective current of 100 A.
Find 100 A on the horizontal axis.
Some manufacturers present current directly in amperes.
Others may express current as a multiple or percentage of the fuse’s rated current.
If the graph uses multiples of rated current:
Current multiple = Circuit current ÷ Fuse rated current
For a 20 A fuse exposed to 100 A:
100 A ÷ 20 A = 5
This represents:
5 × In
where In is the fuse’s nominal current rating.
The calculation identifies the current multiple. It does not determine the opening time by itself.
Step 3: Move Vertically to the Relevant Curve
From the selected current value, follow a vertical line until it reaches the appropriate fuse characteristic.
Confirm whether the manufacturer identifies the curve as:
- minimum melting;
- average melting;
- pre-arcing;
- total clearing;
- maximum clearing;
- or a defined tolerance envelope.
This is a critical step.
A melting-time curve and a total-clearing curve may provide different results at the same current.
Step 4: Read the Time on the Vertical Axis
From the intersection point, move horizontally to the time axis.
The corresponding value indicates the time represented by that particular curve under its stated conditions.
If the graph represents average melting time, the reading is an average or nominal melting estimate.
It is not automatically a guaranteed maximum interruption time.
For an engineering protection study, verify whether a manufacturer-provided maximum clearing characteristic is available and whether it applies to the actual circuit.
Step 5: Verify That the Curve Applies to the Circuit
Before using the result, confirm:
- current type: AC or DC;
- maximum operating voltage;
- prospective fault-current conditions;
- temperature assumptions;
- applicable fuse category;
- manufacturer tolerances.
For a DC circuit, the circuit’s current rise and interruption conditions may also affect the validity of the published data.
A curve reading is only meaningful when the application matches the conditions under which that characteristic is specified.
Melting Time vs Total Clearing Time
One of the most common mistakes is treating the moment the fuse element melts as the moment current stops.
In reality, fuse interruption can involve three stages.
1. Pre-Arcing Time (Melting Time)
Pre-arcing time is the period from the beginning of the relevant overcurrent until the fuse element separates and an arc begins.
During this stage, electrical current heats the fusible element.
Once the element melts, the metallic current path is interrupted—but an electrical arc may still conduct current.
2. Arcing Time
After the fuse element separates, an arc can form between the resulting gaps.
The fuse must extinguish this arc.
The duration depends on factors including:
- current magnitude;
- applied voltage;
- fuse construction;
- arc-quenching design;
- circuit characteristics.
In DC applications, the absence of natural current-zero crossings makes this stage especially important.
3. Total Clearing Time
Total clearing time is the complete time required to interrupt current.
Total Clearing Time = Pre-Arcing Time + Arcing Time
| Parameter | What It Describes |
|---|---|
| Pre-arcing / melting time | Time until the fuse element melts |
| Arcing time | Time from arc initiation to final extinction |
| Total clearing time | Total time until current interruption is complete |
| Minimum melting characteristic | Lower bound of melting behavior where specified |
| Maximum clearing characteristic | Upper bound of total interruption behavior where specified |
Why This Difference Matters
Consider an illustrative fuse event:
- pre-arcing time: 8 ms;
- arcing time: 3 ms.
The total clearing time would be:
8 ms + 3 ms = 11 ms
These are hypothetical values for explaining the relationship, not ratings for an actual fuse.
If an engineer mistakenly interprets the 8 ms melting time as the complete fault-clearing time, the downstream equipment protection assessment may be incorrect.
Different manufacturers also publish different curve formats. Some show only pre-arcing curves, while others provide additional maximum clearing or coordination data.
Always read the graph legend and accompanying technical notes.
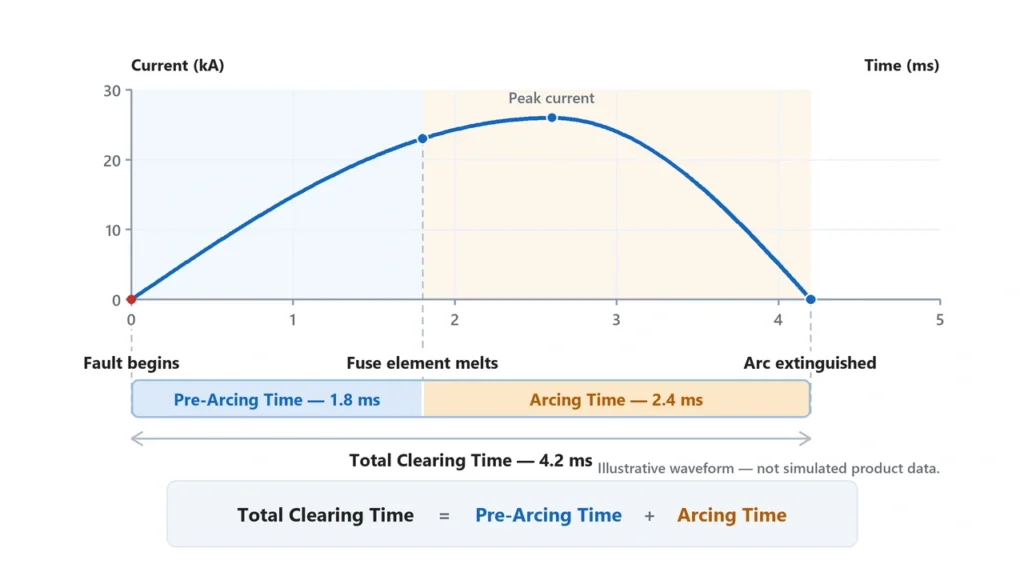
Fuse time current curve showing melting arcing and total clearing timeWhat Is Fuse I²t and How Is It Calculated?
Time-current curves describe fuse response in terms of current and time.
I²t provides another useful characteristic by expressing the integral of current squared over a time interval.
The general formula is:
I²t = ∫ i(t)² dt
where:
- i(t) is instantaneous current;
- t is time;
- I²t is expressed in A²s (ampere-squared seconds).
I²t is often called the Joule integral.
It is related to thermal effects but is not itself an energy value in joules. For a constant resistance R, the associated resistive heating energy is:
E = R × I²t
A fuse’s I²t specification is particularly useful when assessing how much current-squared-time passes through a circuit before the fuse interrupts a fault.
Pre-Arcing I²t
Pre-arcing I²t represents the integral accumulated before the fuse element melts.
It is sometimes called:
Melting I²t
This characteristic can be useful when evaluating temporary current pulses or inrush conditions.
Arcing I²t
Arcing I²t represents the additional current-squared-time accumulated after the element melts but before final arc extinction.
Arcing behavior depends on the electrical conditions of the circuit.
Total Clearing I²t
Total clearing I²t includes the entire fault-interruption period.
Total Clearing I²t = Pre-Arcing I²t + Arcing I²t
For component protection, total clearing I²t is often the more relevant characteristic because the protected equipment is exposed to current during both stages.
Simple I²t Calculation Example
For a hypothetical constant current of 100 A lasting 0.02 s:
I²t = 100² × 0.02
I²t = 200 A²s
This is a mathematical example, not a measured fuse let-through specification.
During an actual current-limiting fault, current usually varies with time, and the complete waveform must be used in the integration.
Does Lower I²t Always Mean Better Protection?
Not automatically.
Lower total clearing I²t can help reduce thermal stress in equipment designed with specific current-squared-time withstand limits.
However, a fuse must also:
- carry normal operating current;
- tolerate legitimate temporary current conditions;
- provide the required overcurrent protection;
- meet the circuit’s DC voltage rating;
- safely interrupt the available fault current.
Different fuse categories are designed for different protection duties.
Mersen explains the difference between peak let-through current and total clearing I²t in its technical guidance on current limitation and arc energy.
For more information about peak let-through current, breaking capacity and HRC terminology, see our Current Limiting Fuse Guide.
Why DC and PV Fuse Curves Need Special Attention
A fuse curve produced under one set of electrical conditions should not automatically be applied to every DC circuit.
DC Has No Natural Current-Zero Crossing
AC current periodically crosses zero, assisting the interruption process.
DC current does not.
After a fuse element melts, the fuse must extinguish the DC arc through its internal interruption design.
That means arcing time and total clearing performance must be verified for the relevant DC duty.
DC Circuit Time Constant Matters
In inductive DC circuits, the fault-current rise is influenced by the circuit’s inductance and resistance.
The time constant is:
τ = L / R
where:
- L is inductance in H;
- R is resistance in Ω;
- τ is time in seconds.
A larger time constant generally means the fault current rises more slowly toward its prospective value in a simple RL circuit.
The current-rise characteristic and stored inductive energy can influence fuse melting and arc interruption.
Mersen explains these effects in its technical paper Fuse Operation Under DC Conditions.
The important engineering conclusion is:
An AC melting-time curve alone does not establish the complete DC fault-clearing performance of a fuse.
Where DC coordination or interruption performance is critical, obtain the manufacturer’s DC-specific data for the relevant conditions.
PV Fault Current Can Be Relatively Low
Photovoltaic strings are current-limited sources.
Some faults may produce current only moderately above normal operating levels rather than the extremely high prospective fault current associated with a large battery or transformer-fed system.
That creates a different selection challenge.
An industrial fuse that interrupts a high short-circuit current rapidly does not automatically provide appropriate protection against the lower overcurrents possible in a PV array.
For photovoltaic protection, IEC identifies dedicated gPV fuse-links.
IEC 60269-6:2010+A1:2021 provides supplementary requirements for PV fuse-links protecting strings and arrays, with the standard’s nominal-voltage scope extending to 1500 V DC.
A suitable PV fuse must therefore satisfy both:
Required current/time characteristic
and:
DC interruption capability for the photovoltaic application
For an explanation of the photovoltaic fuse category, see our gPV Fuse Guide.
How to Use Fuse Curves for Protection Coordination
Fuse time-current curves become particularly useful when checking whether protective devices operate in the intended order.
This is called protection coordination.
Upstream and Downstream Protection
Consider a DC system containing:
DC Source → Upstream Protection → Distribution Circuit → Downstream Fuse → Load
If a fault occurs in the downstream circuit, the desired result may be for the downstream fuse to clear the fault without opening the upstream protective device.
This allows unaffected circuits to remain energized.
However, selectivity is not guaranteed merely because the downstream fuse has a lower ampere rating.
Compare the Operating Characteristics
For a simplified fuse-to-fuse study, the engineer may compare:
- the downstream device’s maximum clearing characteristic;
- the upstream device’s minimum melting characteristic.
Over the relevant prospective fault-current range, the downstream device must complete interruption before the upstream fuse begins to melt if that form of full coordination is required.
However, curve separation alone is not always sufficient.
At high fault currents, current limitation, manufacturer-specific selectivity ratios and I²t characteristics become important.
The final evaluation must use the manufacturer-approved coordination method for the actual device combination.
Compare Fuse I²t With Equipment Withstand
A fuse’s current-limiting performance can also be compared with the withstand capability of protected components.
For example, the application may require the fuse’s total clearing I²t to remain below a component’s specified short-circuit withstand integral.
This comparison must use compatible definitions and test conditions.
Other protective coordination checks may include:
- peak let-through current;
- conductor thermal withstand;
- busbar mechanical withstand;
- equipment short-circuit rating;
- fuse-holder compatibility;
- maximum available fault current.
For PV applications, the first question is still whether overcurrent protection is required and what sources can feed the fault.
See our Solar Panel Fuse Guide and Solar Fuse Sizing Guide for those preliminary decisions.
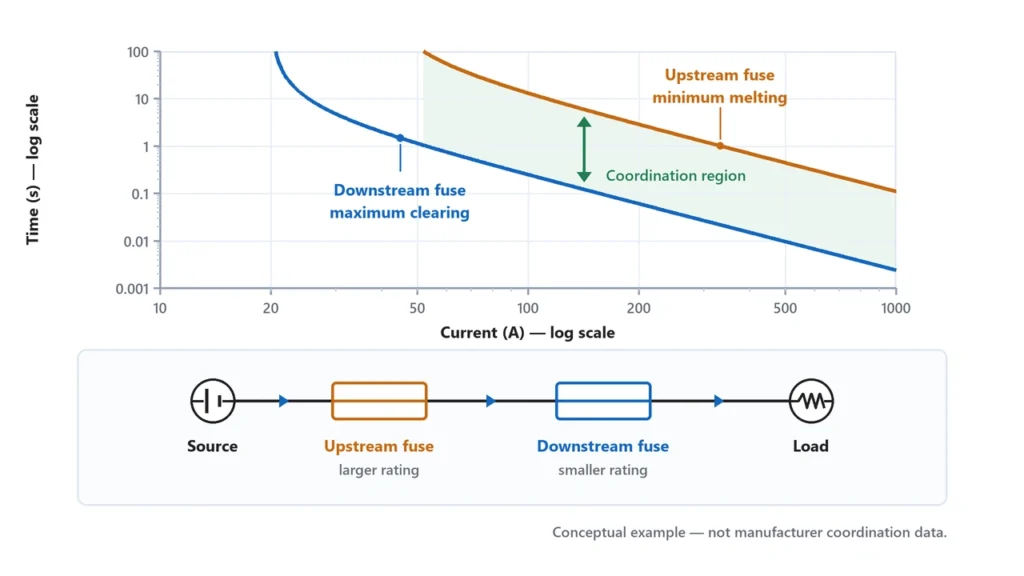
Fuse time current curve comparison for upstream and downstream fuse coordinationCommon Mistakes When Reading Fuse Time-Current Curves
Treating Melting Time as Total Clearing Time
The fuse element may melt before the arc is extinguished.
Use the correct characteristic for the intended engineering calculation.
Reading a Logarithmic Axis as a Linear Axis
Many time-current graphs span orders of magnitude.
Always confirm the axis scale and units.
Using the Wrong Fuse Family’s Curve
Two products with identical voltage and current markings can have different operating characteristics.
Use the exact datasheet and rating.
Assuming the Curve Guarantees an Exact Trip Time
An average melting curve does not define an exact opening time for every manufactured fuse and operating condition.
Check the manufacturer’s published tolerances or minimum/maximum characteristics.
Ignoring the DC Application Conditions
DC voltage, circuit time constant, available fault current and interruption conditions matter.
Do not treat generic AC time-current data as a complete DC protection study.
Assuming a High Breaking Capacity Means Fast Operation at Every Current
Breaking capacity defines an interruption limit under specified conditions.
It does not guarantee rapid operation under every possible overcurrent.
Comparing I²t Values From Different Test Conditions
Pre-arcing I²t and total clearing I²t are different.
DC and AC values may also differ.
Confirm that the specifications being compared refer to compatible operating conditions.
Ignoring Fuse Temperature and Holder Compatibility
Time-current performance can be affected by thermal operating conditions.
A fuse must also be coordinated with its holder, terminals, conductor and installation environment.
What to Request From a DC Fuse Manufacturer
For an engineering procurement or OEM project, a fuse datasheet should ideally provide the information needed to evaluate both current-carrying and fault-interruption performance.
| Technical Data | Why It Matters |
|---|---|
| Fuse model and rated current | Identifies the exact fuse characteristic |
| Rated DC voltage | Establishes application voltage limits |
| Utilization category | Identifies intended protection duty |
| Breaking capacity | Defines maximum interruptible prospective fault current |
| Time-current curve | Describes response to overcurrent |
| Curve designation | Distinguishes melting, clearing and tolerance characteristics |
| Pre-arcing I²t | Supports thermal and pulse evaluation |
| Total clearing I²t | Supports fault let-through assessment |
| Peak let-through curve | Helps evaluate instantaneous fault-current limitation |
| DC test conditions | Establishes applicability to the intended DC circuit |
| Temperature correction | Supports installed current-carrying assessment |
| Holder compatibility | Ensures a suitable protection assembly |
Not every fuse datasheet provides every item publicly.
Where detailed coordination is required, additional manufacturer test data or application engineering support may be necessary.
For a solar PV project, the complete selection should consider:
PV Module → String Current → Available Fault Current → Fuse Characteristic → Fuse Holder → Conductor → Downstream Equipment
The key conclusion is that a fuse time-current curve is a protection characteristic, not a complete protection specification.
Read the curve together with the product’s current rating, DC voltage, breaking capacity, gPV classification, I²t data and the intended circuit conditions.
For UHCCY photovoltaic fuse links and compatible fuse holders, visit our DC Fuse range. Final device selection and coordination should use the technical data for the exact product and the requirements of the actual installation.